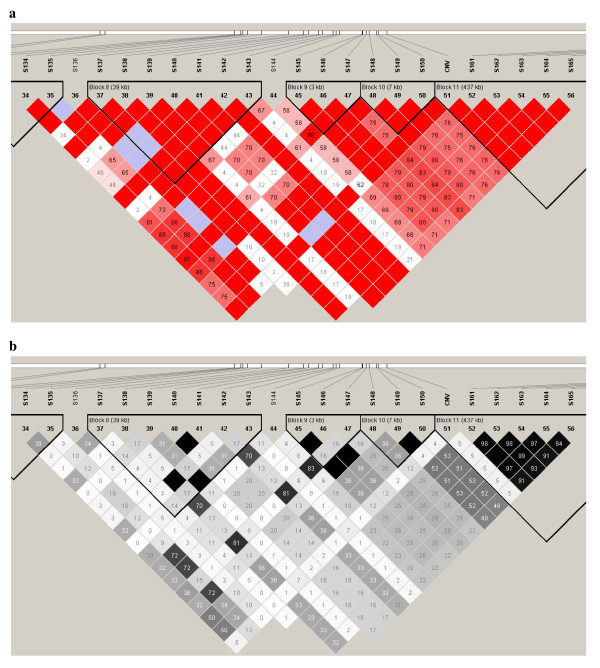
Figure 3.
a. Linkage disequilibrium plot (from HaploView) based on D' for the SNP surrounding the CNV. Key: when LOD < 2, D' < 1 is white and D' = 1 is blue; when LOD > 2, D' < 1 is given in shades of pink/red and D' = 1 is given in bright red; the pair-wise D' values are given in the boxes. b. Linkage disequilibrium plot (from HaploView) based on r2 for the SNP surrounding the CNV. Key: r2 = 0 is given in white, 0 < r2 < 1 is given in shades of grey and r2 = 1 is given in black.

