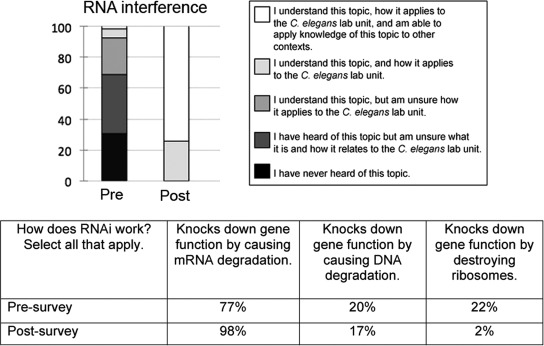
Figure 4.
Student self-reports of understanding, and student knowledge of RNAi. Bar graphs show the percentage of students (out of 100%) who chose the indicated responses on pre- and postsurveys. The data for 2007 and 2008 were very similar and were therefore combined (presurvey: n = 219; postsurvey: n = 221).

