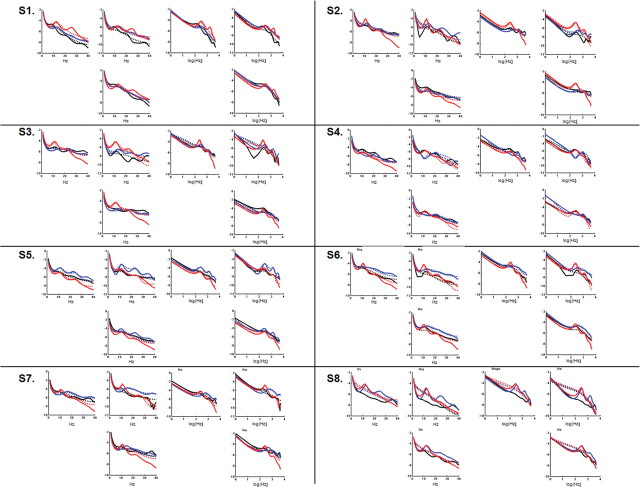
Figure 3.
This figure shows that the single-subject model fits (solid lines) for source-level power spectra and cross-spectral densities as computed by DCM could satisfyingly account for the original power spectrum data (in dashed lines). For each subject (S1–S8), wakefulness, mild sedation, and LOC data are displayed respectively in black, blue, and red. Model fits are provided both as semi-log and log–log plots. CSD, Cross-spectral density.

