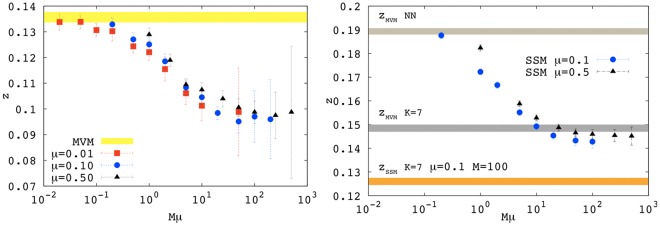
Figure 3. Exponent z for the SSM as a function of  at fixed
  .
.
The left panel shows the case  for
for  with NN-kernel. The shaded area indicates the value
  (including the estimated error) of the exponent for the MVM with
  . For
. For  statistical errors increase because a smaller number of realizations was used as simulations become very costly. The right panel shows the case
  for
for  with NN-kernel. The shaded areas display the value of the exponent for the MVM with both the NN- and square-kernel (K = 7) and the SSM with square-kernel (K = 7) for M = 100 and
  (i.e.
(i.e.  ).
).

