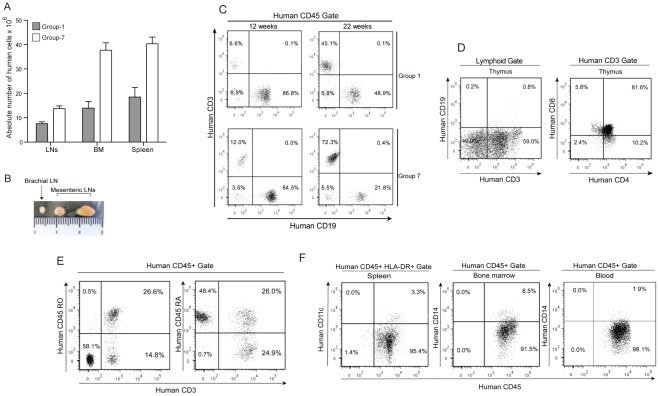
Figure 2. Human cell differentiation in humanized NSG mice.
(A) Absolute number of human cells in lymph nodes, bone marrow and spleens of group 1 and group 7 mice. (B) Mesenteric and brachial lymph nodes from male mice obtained after 24 weeks of CD34+ cell transplantation in group 7 mice. (C) Flow cytometric analysis of engraftment percentage of CD3+ T cells and CD19+ B cells at 12 and 22 weeks after transplantation of CD34+ cells in representative mice from group 1 and group 7. (D) Flow cytometric analysis of CD4+CD8+, CD4+ and CD8+ population in thymus of 22 weeks engrafted mice. (E) Flow cytometric analysis of CD45RA+ and CD45RO+ positive CD3 cells 22 weeks after engraftment in mice from group 7. (F) Representative profile CD11c+ cells in spleen and CD14+ population in bone marrow and blood of group 7 mice 22 weeks after CD34+ cell transplantation.

