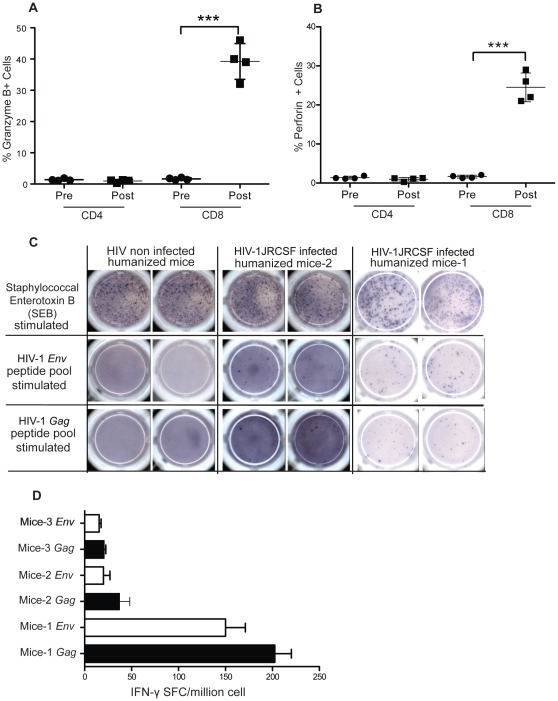
Figure 7. T-cells cellular immune responses to HIV infection.
(A, B) Expression of cytotoxic effector molecules perforin and granzyme B are measured by flow cytometry before and 6 weeks after HIV-1 infection in humanized NSG mice (n = 4). Means are shown in solid lines and P values were determined by paired student’s t-tests, are shown for significant statistical comparisons. (C) ELISPOT assay measured IFN-γ secretion from mononuclear cells, pooled from lymph nodes and spleen and stimulated with HIV-1 gag or env peptides. In left panel of engrafted but noninfected mice, non-specific stimulation with SEB lead to generation of response and no IFN- γ secreting cells could be detected after HIV-1 peptide stimulation. In the middle and right panels of HIV infected mice, IFN-γ responses were seen with nonspecific stimulation with SEB but also when stimulated with HIV-1 peptide. HIV-1 Gag peptides stimulation responses were higher than HIV-1 env peptides in all infected mice. (D) Quantification of IFN-γ secreting HIV-1-specific T cells in an HIV-1-infected humanized mice detected by an ELISPOT assay. Pools of peptides spanning all of gag and env were used for overnight stimulation. Each spot represent IFN-γ secreting cell. The frequency of responses is depicted as IFN-γ spot-forming cells per 106 cells.

