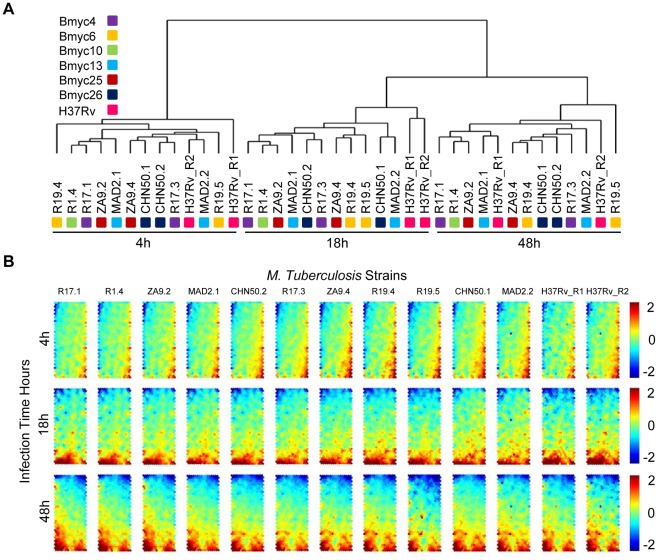
Figure 2. Transcriptome classification of THP-1 cells to W-Beijing strains as well as the lab strain H37Rv.
(A) Sample classification of THP-1 transcriptome responses to Mtb W-Beijing and H37Rv strains.W-Beijing strains from the same node (see Figure 1) were highlighted by the same color. For example, two CHN50 strains (CHN50.1 and CHN50.2) from node Bmyc26 were colored in black. (B) Component plane presentation integrated self-organizing map (CPP-SOM) of host transcriptomic responses to 11 different W-Beijing family strains as well as duplicated H37Rv (columns) at 3 time points (rows). Each presentation illustrates a sample- and time-specific transcriptome map, in which all the up-regulated (represented by neurons in red), down-regulated (represented by neurons in blue) and moderately regulated (represented by neurons in yellow and green) genes were well delineated. Linking these presentations allows visual-easy comparisons of transcriptome changes across time points and strains.

