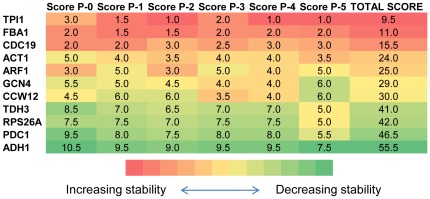
Figure 1. Scoring of the candidate genes in Case Study I.
The cells representing the scores of the genes in different pools were colour coded. A coding scale from red to green indicated decreasing stability. The score of the genes in each pool was indicated by the number assigned to that cell in a quantitative manner; the smallest score indicating the most stable gene and the largest score indicating the least stable one. The stability of the gene associated with that score was also indicated by the colour assigned to that cell in a qualitative manner. The scoring of the six different pools of candidate genes was determined as the average ranking for each gene as indicated by the NormFinder and the geNorm analyses and the results were provided in the first six columns. The analysis was carried out using all genes (P-0), and using the 5 pools, each excluding a different set of correlated genes (P-1 to P-5). The total score for each gene was provided in the last column by summing up all of its scores through P-0 to P-5.

