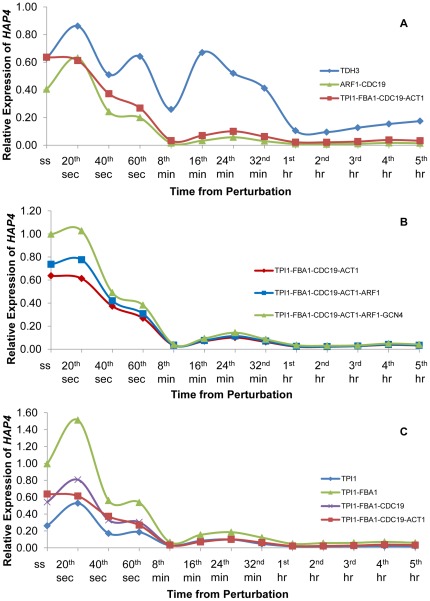
Figure 2. Expression profile of HAP4 in response to the relaxation from glucose limitation.
This figure represents the expression profile for HAP4 using different combinations of reference genes, which were selected from the candidate pool. The expression profiles were calculated using TDH3; a commonly selected reference gene, using ARF1 and CDC19; the two most stable genes identified from P-0 by geNorm, and using TPI1, FBA1, CDC19 and ACT1; the final set of most stable genes (A). The contribution of increasing the number of genes in the final reference set to the expression profile of HAP4 was investigated by adding ARF1 and GCN4 to the reference gene set in the given order (B). The effect of reducing number of genes in the final reference gene set on the expression profile of HAP4 was investigated. The number of reference genes included in the set was reduced by one each time starting from the least stable gene in the set (C). For each individual profile, the reference genes, which were used in the determination of HAP4 expression, were indicated by different colours in the legend.

