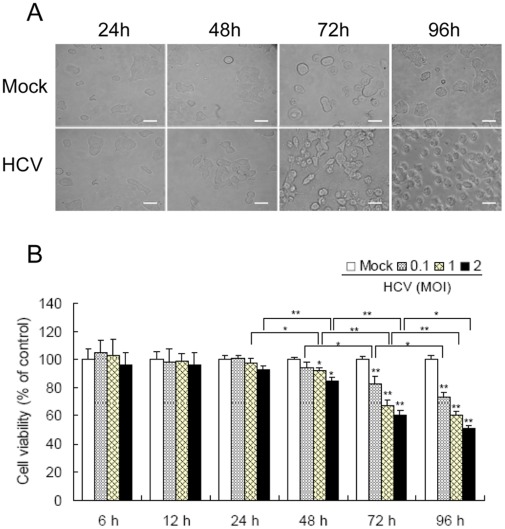
Figure 1. HCV infection decreases MIN6 cell viability.
(A) The images of MIN6 cells infected with HCV at 24, 48, 72 and 96 hpi. MIN6 cells were mock-infected or infected with 1.0 MOI of the supernatant of HCV-infected Huh7.5.1. Scale bar, 10 µm. (B) MIN6 cells were infected with HCV at different MOIs. At indicated time points post-infection, the percentage of viable cells was assessed by MTT assay and plotted versus time. The activity measurements were done in triplicates. Data represent means + SD of three independent experiments (n = 9). *P<0.05, **P<0.01, compared with respective controls.

