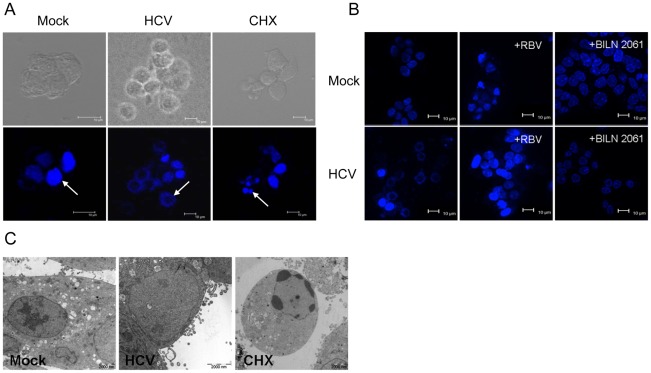
Figure 3. HCV infection induces novel morphological changes of MIN6 cells.
(A–C) Confocal image of MIN6 cells stained with Hoechst 33258. Scale bar, 10 µm. Cells were mock infected or infected with 1.0 MOI HCV for 96 h. Cells treated with CHX for 48 h served as an apoptosis positive control. White arrows indicate nuclei (A). MIN6 cells were treated as in Figure 2A (B). Cells were mock-infected or infected with HCV particles (1.0 MOI) with addition of RBV (50 µM) or BILN 2061 (10 µM) at 96 hpi (C). (D) Electron microscopic analysis as in (A). Scale bar, 2 µm. All measurements were done in triplicates.

