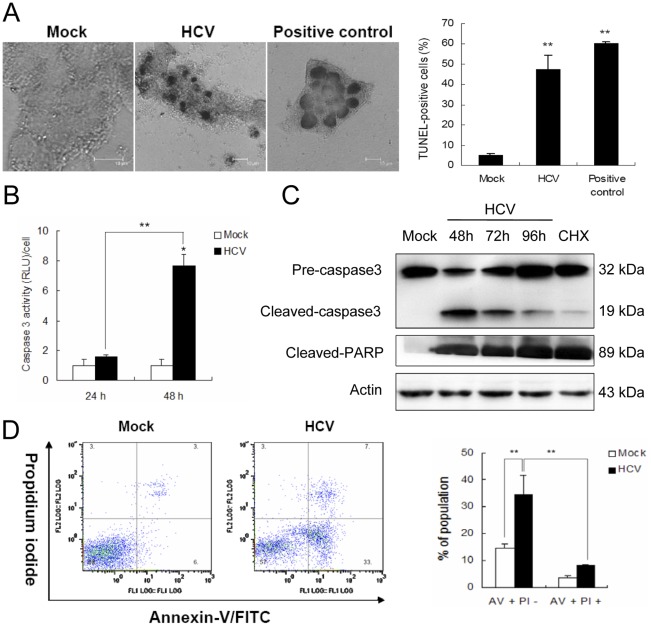
Figure 4. HCV infection induces apoptosis-like cell death in MIN6 cells.
MIN6 cells were mock-infected or infected with 1.0 MOI of HCV. (A) Confocal image of cells stained with TUNEL at 96 hpi. Scale bar, 10 µm. Quantitative summary of the TUNEL-positive staining is provided on the left. (B) Caspase 3 activity levels at 24 and 48 hpi. The caspase 3 activity of the control cells at 0 h after treatment was arbitrarily expressed as 1.0. (C) Immunoblot analysis of caspase 3 and PARP at 48, 72, 96 hpi. Cells treated with CHX (50 ng/ml) for 48 h were served as an apoptosis positive control. Immunoblots are representative of at least three independent experiments. Amounts of actin were measured as an internal control to verify equivalent sample loading. (D) Diagrams of FITC-Annexin V/PI flow cytometry in a representative experiment at 48 hpi. Numbers in the quadrants indicate the proportions of cells in the corresponding areas (left panel). (A, B, D) All measurements were done in triplicates. Data represent means + SD of three independent experiments (n = 9). **P<0.01, compared with respective controls.

