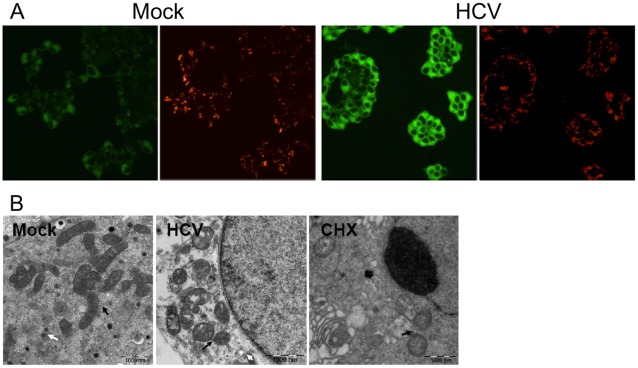
Figure 5. Mitochondrial changes in HCV-infected MIN6 cells.
MIN6 cells were mock-infected or infected with 1.0 MOI of HCV. (A) Mitochondrial transmembrane potential changes at 48 hpi. Representative images from JC-1 staining are shown. The aggregated form of JC-1, characteristic of mitochondrial integrity (red) and monomeric JC-1 (green) were examined under laser confocal scanning microscope. (B) Electron microscopy of mitochondrial morphologies at 96 hpi. Cells treated with CHX (50 ng/ml) for 48 h were served as an apoptosis positive control. Black and white arrows indicate mitochondria and insulin granules, respectively. Scale bar, 1 µm.

