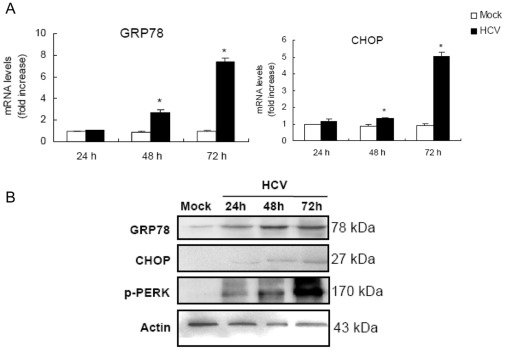
Figure 6. HCV infection induces ER stress in MIN6 cells.
(A) mRNA levels of GRP78 and CHOP. MIN6 cells were mock-infected or infected with 1.0 MOI HCV for 24, 48, 72 h. mRNA was analyzed by real-time RT-PCR. The results were normalized with the values obtained from actin in the same sample. Data are expressed as fold-increase relative to the values observed in mock control. The measurements were done in triplicates. Data represent means + SD of three independent experiments (n = 9). *P<0.05, compared with respective controls. (B) Immunoblot analysis of GRP78, CHOP and p-PERK corresponding to (A) probed with the indicated antibodies. Amounts of actin were measured as an internal control to verify equivalent sample loading. Immunoblots are representative of at least three independent experiments.

