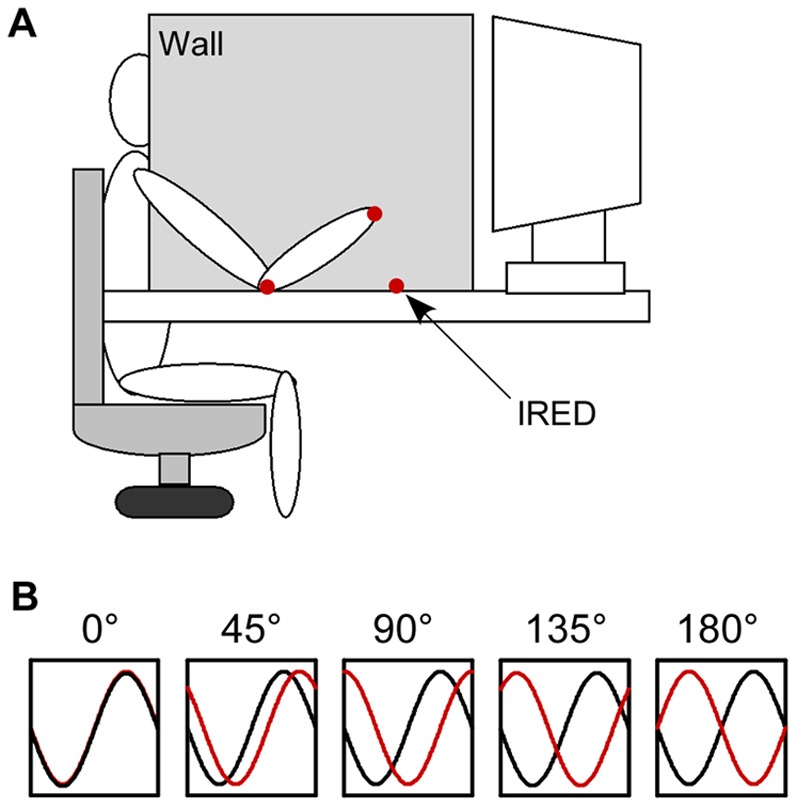
Figure 1. Experimental setup and the required target patterns.

In the required patterns (B), the black curve represents the external signal and the red curve represents the required signal that a participant is supposed to produce.

In the required patterns (B), the black curve represents the external signal and the red curve represents the required signal that a participant is supposed to produce.