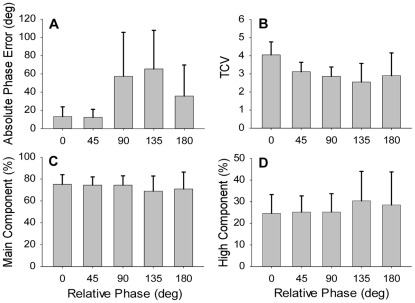
Figure 3. Mean absolute phase errors, TCV values, and percentages of main and high frequency components as a function of required target pattern.
Differential accuracy and stability were found among the five tracking patterns with the 0° relative phase pattern being the most accurate and stable pattern (A and B). Differential intermittency among the five patterns was not found (D). The error bars represent the standard deviation of the between subject variability.

