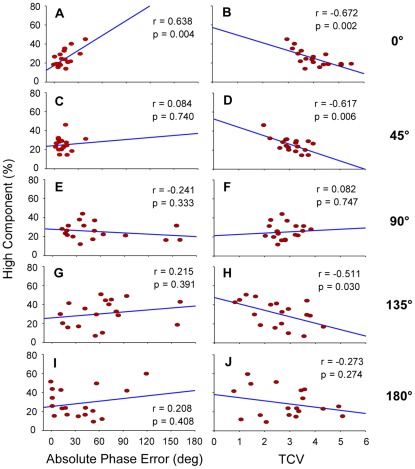
Figure 4. Results of correlation analyses.
Correlations between absolute phase error and high component percentage (A, C, E, G, and I), and between TCV and high component percentage (B, D, F, H, and J) are plotted as a function of required relative phase: 0°, 45°, 90°, 135° and 180°. Corrective movements were correlated with changes in accuracy only for the 0° target pattern (A). The amount of corrective movements decreased as the stability of tracking performance increased for the 0°, 45°, and 135° patterns (B, D, and H). For the 90° and 180° target patterns, the amount of corrective movements was not correlated with pattern accuracy (E and I) or pattern stability (F and J). Pearson's correlation coefficients (r) and p-values are presented. Blue lines represent correlation lines.

