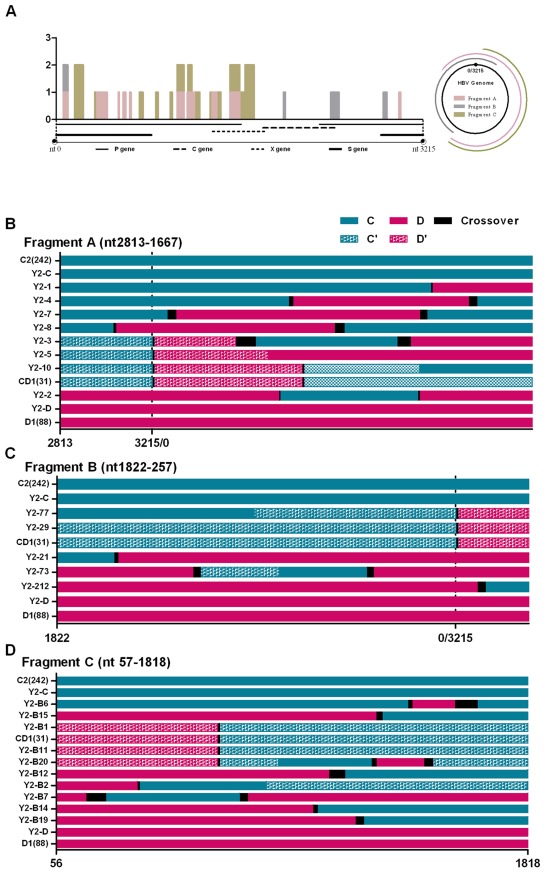
Figure 3. Alignment and recombination crossover regions found in Y2 clones.
(A) Frequency and distribution of the recombination crossover regions found in Y2 clones along the HBV genome. The bars indicate the number of clones (y axis) showing recombination crossover regions at each site. The 1-3215 of x axis was consistent with the nt1-3215 of HBV genome. Different colors represent the sites find from clones of different PCR region: pink bars for fragment A, grey bars for fragment B and green bars for fragment C. (B) Alignment of fragment A (HBV nt 2813-0-1667). Y2-1′12: clones from fragment A of Y2 patients. (C) Alignment of fragment B (HBV nt 1822-0-257). Y2-21′212: clones from fragment B of Y2 patients. (D) Alignment of fragment C (HBV nt 57-1818) of Y2 clones. Y2-B1′B22: clones from fragment C of Y2 patients. The number on the x axis was consistent with the site of nucleotides of HBV genome. Solid green lines are genotype C2, solid pink lines are genotype D1, speckled green lines are the C2 component of genotype recombinant CD1 and speckled pink lines are the D1 component of recombinant genotype CD1. The black lines are sequence that is common to the recombining genotypes, and within which the recombination probably occurred. C2 (242) is the consensus sequence formed by 242 subgenotype C2 sequences from GenBank. D1 (88) is the consensus sequence formed by 88 subgenotype D1 sequences from GenBank. CD1 (33) is the consensus sequence formed by CD1 recombinant sequences from GenBank.

