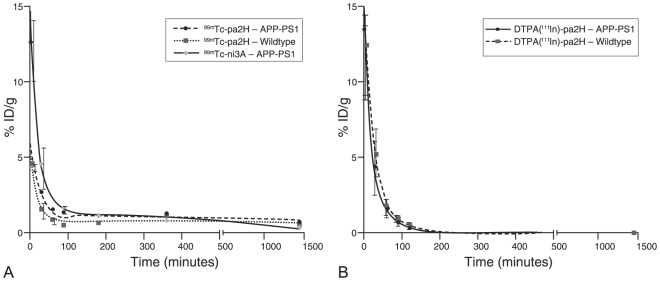
Figure 2. Blood clearance.
These graphs represent the blood half lives of tagged 99mTc-ni3A and -pa2H (A), and untagged DTPA(111In)-pa2H (B) in APP/PS1 mice and wildtype littermates. Data is shown as percentage of injected dose per gram of blood (%ID/g) over time. Based upon this plot the clearance is suggested to respectively consist of a fast and a slow phase, or only a single phase.

