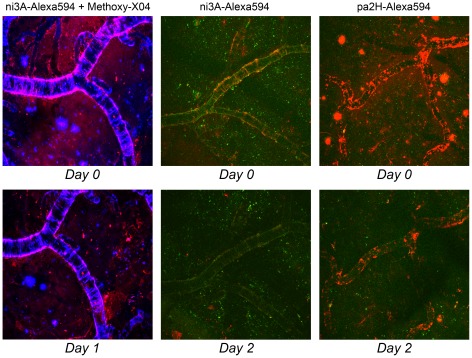
Figure 3. In vivo Aβ imaging after direct brain application.
Topical application of ni3A- or pa2H-Alexa594 (red) as visualized over time by intravital multiphoton microscopy in APP/PS1 mice clearly shows the specific in vivo labeling of different Aβ deposits. In the left, vascular and parenchymal Aβ deposits, detected by prior labeling with Methoxy-X04 (blue), colocalize with ni3A-Alexa594 (red) directly following topical application. One day later, labeling of the plaques has diminished to almost none with some residual left bound to CAA. With interpretation hampered by Methoxy-X04, middle images show a similar experiment. Colocalization with Aβ deposits based upon autofluorescence (green) gave comparable results and almost complete wash out after two days. Pa2H-Alexa594 (red), as shown in the right images, remains bound to vascular Aβ even two days after application, when the plaques remained undetected. All images are maximum intensity projections of a 3D cortical volume with a field of view 615×615 µm.

