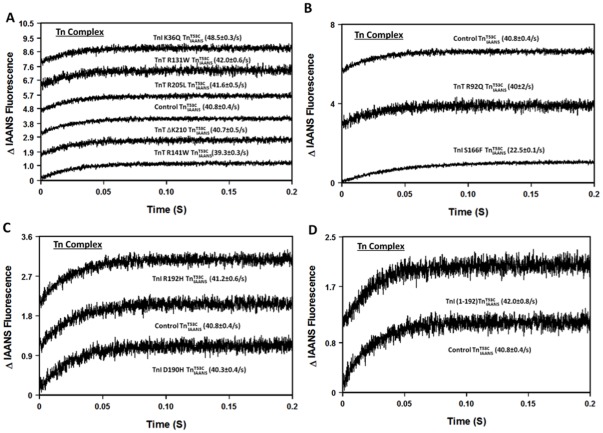
Figure 2. Effect of disease-related protein modifications on the rate of Ca2+ dissociation from the Tn complex.
Panel A shows the time courses of the increase in IAANS fluorescence as Ca2+ was removed by EGTA from control  , and the DCM mutants, TnI K36Q
  , TnT R131W
  , TnT R141W
  , TnT R205L
  and TnT ΔK210
  . Panel B shows the time courses of the increase in IAANS fluorescence as Ca2+ was removed by EGTA from control
  , and the HCM mutants, TnT R92Q
  and TnI S166F
  . Panel C shows the time courses of the increase in IAANS fluorescence as Ca2+ was removed by EGTA from control
  , and the RCM mutants, TnI D190H
  and TnI R192H
  . Panel D shows the time courses of the increase in IAANS fluorescence as Ca2+ was removed by EGTA from control
  and ischemic related truncated TnI (1-192)
  . All
. All  complexes consist of the full length Tn subunits of
  , TnI and TnT, except for ischemic related truncated TnI (1-192). The disease related modification is either in TnI or TnT, in either case, the other protein (TnT or TnI) was wild type. Data traces (an average of 3 to 5 individual traces collected at least 10 times) were fit with a single exponential equation to calculate the kinetic rates. The data traces have been staggered and normalized for clarity.

