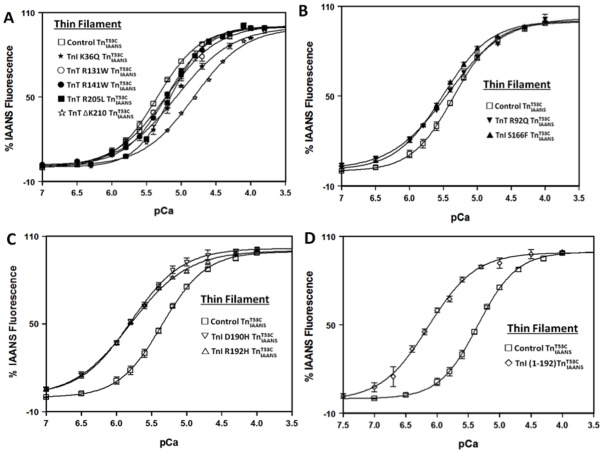
Figure 3. Effect of disease-related protein modifications on the Ca2+ binding sensitivity of the thin filament.
Panel A shows the Ca2+ dependent increases in IAANS fluorescence for thin filament bound control  (□), and the DCM mutants, TnI K36Q
  (
( ), TnT R131W (○)
 , TnT R141W
  (•), TnT R205L
  (▪) and TnT ΔK210
  (⋆) as a function of pCa. Panel B shows the Ca2+ dependent increases in IAANS fluorescence for thin filament bound control
  (□), and the HCM mutants, TnT R92Q
  (▾) and TnI S166F
  (▴) as a function of pCa. Panel C shows the Ca2+ dependent increases in IAANS fluorescence for thin filament bound control
  (□), and the RCM mutants, TnI D190H
  (▽) and TnI R192H
  (▵) as a function of pCa. Panel D shows the Ca2+ dependent increases in IAANS fluorescence for thin filament bound control
  (□) and ischemic related truncated TnI (1-192)
  (
( ) as a function of pCa. The data sets were normalized individually for each mutant. All
  complexes consist of the full length Tn subunits of
  , TnI and TnT, except for ischemic related truncated TnI (1-192). The disease related modification is either in TnI or TnT, in either case, the other protein (TnT or TnI) was wild type. The Ca2+ sensitivities were reported as a dissociation constant Kd, representing a mean of three to four separate titrations ± S.E.M.

