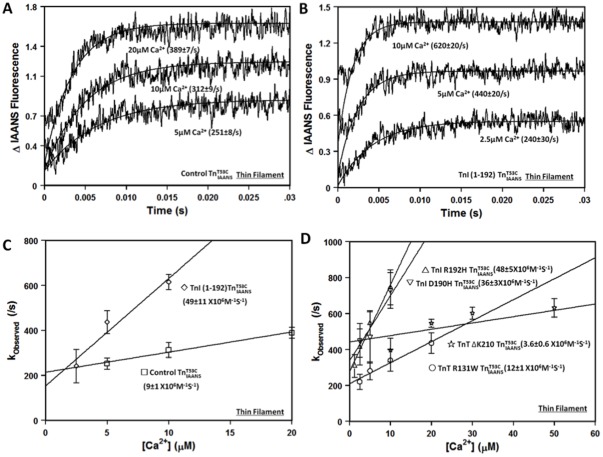
Figure 6. Effect of disease-related protein modifications on the rate of Ca2+ association to the thin filament.
Panel A shows the kinetic traces (an average of 3 to 5 individual traces collected at least 9 times) observed for Ca2+ association to thin filament bound control  at 5 µM, 10 µM and 20 µM Ca2+ ([Ca2+] after mixing). Panel B shows the kinetic traces (an average of 3 to 5 individual traces collected at least 9 times) observed for Ca2+ association to thin filament bound TnI(1-192)
  at 2.5 µM, 5 µM and 10 µM Ca2+. The rate of the fluorescence increase when Ca2+ associates with the thin filament was fit with a single exponential to calculate the observed rate (kobserved). All
  complexes consist of the full length Tn subunits of
  , TnI and TnT, except for ischemic related truncated TnI (1-192). The disease related modification is either in TnI or TnT, in either case, the other protein (TnT or TnI) was wild type. Panel C shows the plots of kobserved versus [Ca2+] for thin filament bound control
  (□) and TnI (1-192)
  (
( ). The rate of Ca2+ association to the thin filament was obtained by calculating the slope of a linear fit to the data. Panel D shows the plots of kobserved versus [Ca2+] for thin filament bound TnI R192H
  (▵), TnI D190H
  (▽), TnT ΔK210
  (⋆), and TnT R131W
  (○).
(○).

