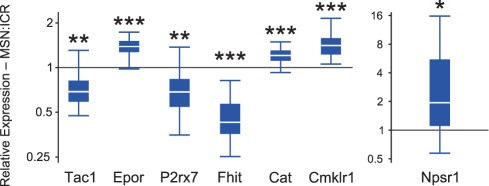
Figure 3. RT-qPCR confirmation results for seven genes from the microarray.
Ratio distribution is graphed as a box-and-whiskers plot. Ratios greater than 1 represent genes with higher expression in the MSN strain and ratios less than 1 represent genes with lower expression in the MSN strain relative to the ICR strain. *P<0.05; **P<0.01; ***P<0.001.

