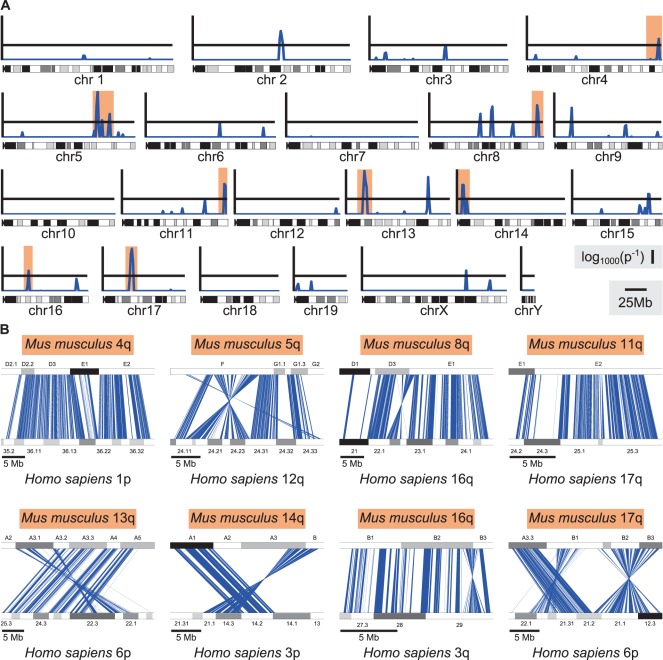
Figure 4. Genome enrichment analysis and homology of highlighted enriched clusters to the human genome.
A) Genome enrichment analysis of the MSN phenotype using a novel enrichment algorithm we created for this study (see Materials and Methods). The y-axis represents the log10 inverse of the corrected binomial probability that a cluster of dysregulated genes would occur by chance. The black horizontal lines demarcate a cluster occurring by chance with a 0.001 corrected probability, consistent with a LOD or NPL score of 3 in a linkage study. Spikes above the black lines indicate dysregulated gene clusters highly unlikely to occur by chance, indicating that the genome region is significantly enriched. Corrected probabilities less than 1×10⁻⁹ are collapsed to 1×10⁻⁹. B) Shared synteny, a similar clustering of orthologous genes, between the clusters on the murine genome highlighted in orange in Fig. 4.A and human genome regions strongly implicated in BPD (see Results for details). Blue lines represent orthologous genes and their positions in the murine (upper) and human (lower) genomes.

