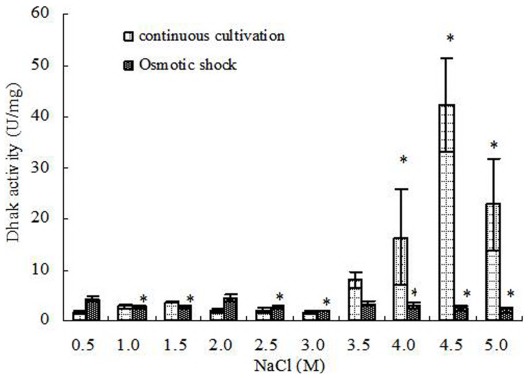
Figure 5. Dhak activity in D. salina cells under different salinity stresses.
Columns represent the means of three replicated studies in each sample, with the SD of the means (T test, P<0.05). The significance of the differences between the control (2.0) and test values were tested by using one-way ANOVA. *, P<0.05 vs control.

