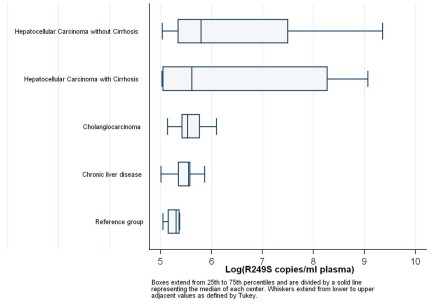
Figure 3. Box and whisker distributions of TP53 R249S-mutated DNA plasma concentrations (≥150 copies/mL) for the different groups.
Boxes extend from 25th to 75th percentiles and are divided by a solid line representing the median of each centre. The median levels for the different groups are: 328 in HCC/no cirrhosis, 273 in HCC/cirrhosis, 252 in CC, 256 in CLD and 202 in R.

