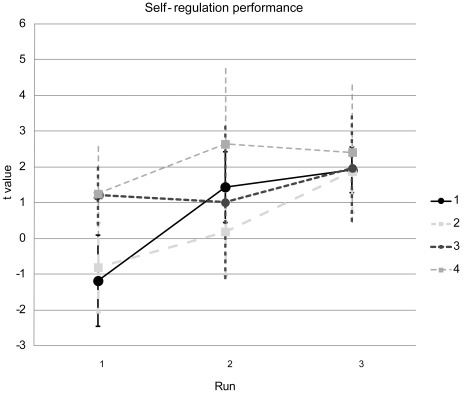
Figure 2. Neurofeedback success.
Although self-regulation performance was varied during the first run (indicated by the low t values, scaled on the y-axis), participants achieved reliable upregulation during runs 2 and 3, with more stability in the later sessions. Data points represent group means and error bars represent the SD.

