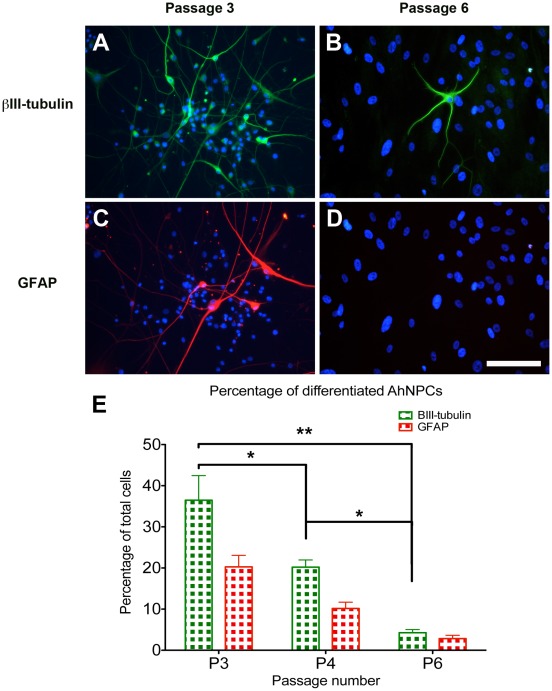
Figure 3. Photomicrograph and bar graph illustrating the decrease in neurogenic capabilities observed with increased culture duration.
(A, C) Illustrates the extent of neuronal (βIII-tubulin) and astrocytic (GFAP) differentiation seen after 3 weeks of differentiating AhNPCs from cultures at passage 3. (B, D) Illustrates the same parameters when AhNPC cultures from passage 6 were differentiated. These images demonstrate the dramatic decline in the neurogenic capabilities of the AhNPC cultures with increased culture duration. (E) Quantification of the percentage of differentiated neurons and astrocytes derived from the 3 independent cases using automated images analysis. Statistical analysis using one-way Anova demonstrates the significant reduction in the percentage of βIII-tubulin cells (* = P<0.05, ** = P<0.01).

