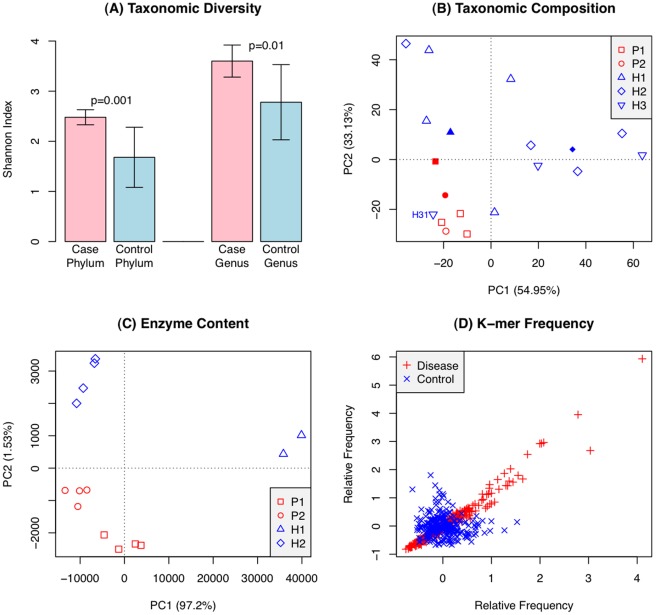
Figure 3. Systems-level analysis reveals the disease state to occupy a narrow region within the space of possible states for the microbiome.
A – Shannon diversity calculated from 16S rDNA data is significantly higher in diseased samples (community is more diverse). B – Principal Component Analysis of the taxonomic compositions from 16S rDNA (empty symbols) and pooled WGS data (filled symbols). Disease samples cluster together in the bottom left corner. Sample H31 (tooth with incipient periodontal disease from an otherwise healthy patient) clusters together with the disease samples. C – Principal component analysis of the enzyme content of samples based on metagenomic sequencing. The PCA graph shows a tighter clustering of disease samples (red) relative to the healthy ones (blue). This suggests that the disease state may be linked to a specific metabolic configuration, and that the space of disease configurations is more constrained than the healthy one. Replicates (forward/reverse reads from one or two instrument lanes) are shown separately as identical symbols, and exhibit minimal metabolic variation within each sample. D – Comparison of relative frequencies of tetramers (4 bp motifs) in metagenomic reads across disease cases (in red, P1 vs. P2) and across control cases (in blue, H1 vs. H2). Based on the relative frequencies of tetramers, disease samples are more similar to each other (points lie along the diagonal) than controls are to each other.

