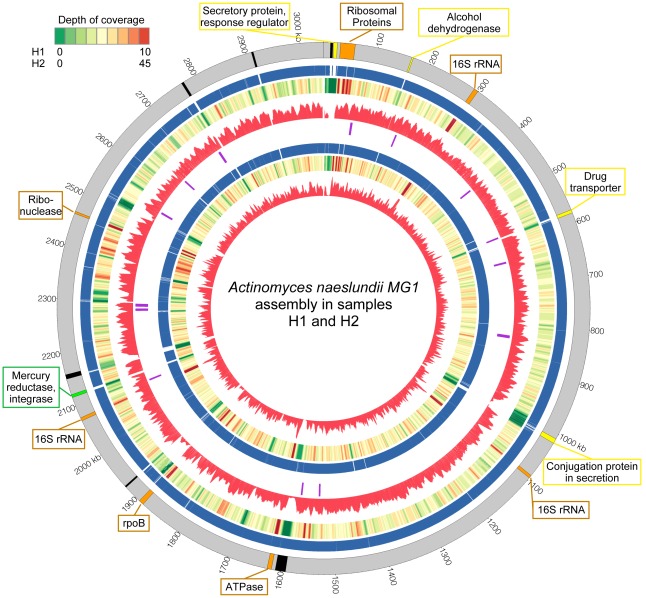
Figure 5. Comparative analysis of the Actinomyces naeslundii MG1 reference genome (HOMD SeqID SEQF1063), and assemblies from samples H1 and H2.
Counting from outside, the first ring is the reference genome with genes annotated by colored bands: orange bands are conserved genes; green bands are genes involved in horizontal gene transfer; yellow bands are genes with known functions; black bands are genes with unknown functions. Only regions that are associated with genomic variations are colored and annotated. The second and sixth rings are the assembled contigs from sample H2 and H1. The heatmaps in the third and seventh rings represent the depth of coverage of the contigs with 5K bp window and 100 bp step for sample H2 and H1. The histograms in the fourth and eighth rings represent the scaled SNP rate with 5 Kbp window and 100 bp step for sample H2 (max = 0.08) and H1 (max = 0.03). The purple bands in the fifth ring represent regions with significantly higher theta values than average (p< = 0.05). Image generated with Circos [86].

