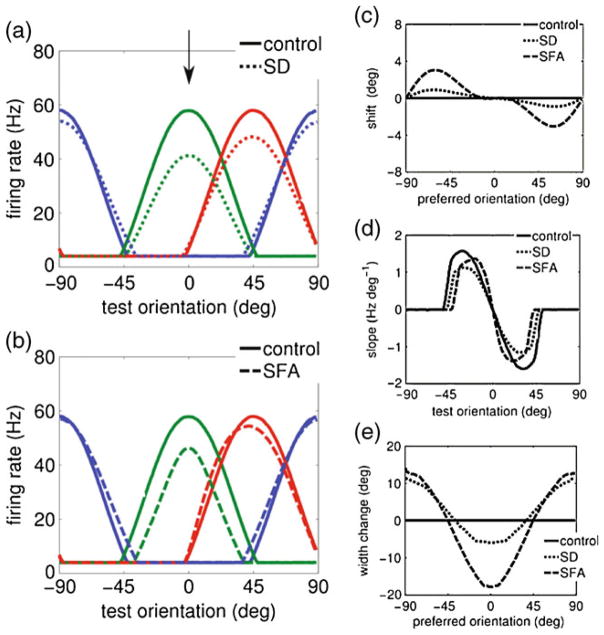
Fig. 2.
Effect of adaptation on the tuning curves of individual neurons. (a–b) Tuning curve properties for the different adaptation mechanisms: synaptic depression (SD) and spike-frequency-adaptation (SFA). Individual neuron tuning curves before and after adaptation. The tuning curves are shown for neurons with a preferred orientation of 0 (green), 45 (red) and 90 (blue) degrees, before (solid lines) and after adaptation (dashed lines). The adapter orientation was set to zero degrees (marked with an arrow in panel (a)). (c–e) Changes in tuning curves properties after adaptation. (c) Postadaptation tuning curve shift (center of mass) for all neurons. Both SD and SFA yielded an repulsive shift towards the adapter. (d) The slope of the tuning curve of a neuron with preferred orientation of zero degrees (green curve in panels (a–b)) as a function of the test orientation. The absolute value of the slope at small test angles increased with SFA, whilst the slope decreased with SD adaptation. (e) The change in the tuning curve width for the neurons in the population with respect to the control condition. For both SD and SFA the tuning curves narrowed for neurons with a preferred angle close to the adapter orientation, and widened far from the adapter orientation

