
Figure 2.
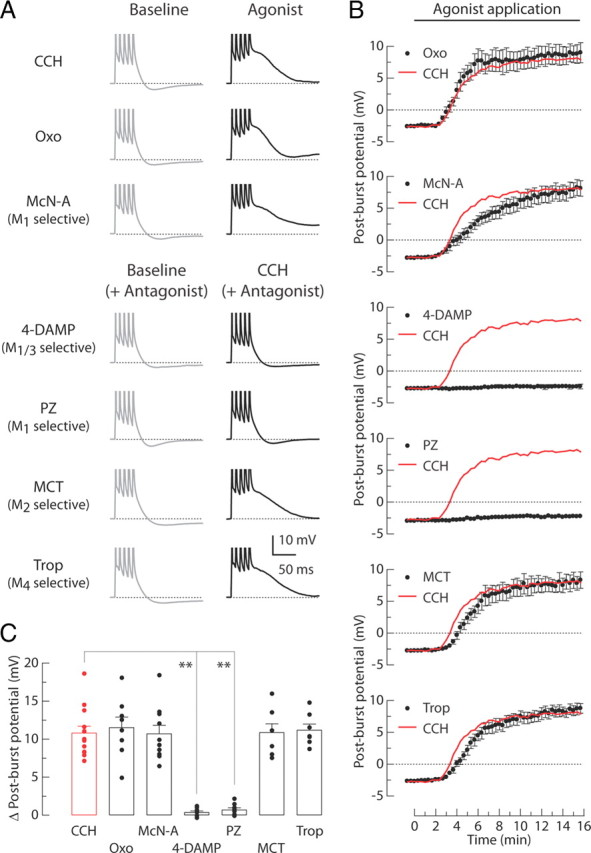
M1 receptors mediate the CCH-induced post-burst ADPs. A, Individual responses to bursts of five APs in baseline condition (left, gray) or 15 min after application of agonists (right, black). Experiments were performed in seven different groups: 8 μm CCH, 1 μm Oxo, or 100 μm McN-A in agonist tests; 0.1 μm 4-DAMP, 0.1 μm PZ, 0.2 μm MCT, or 0.2 μm Trop with 8 μm CCH in antagonist tests. B, Time courses of the post-burst potential amplitudes after application of agonists beginning at t = 0 min. Red lines indicate the averaged response from the CCH-treated group without antagonists. C, Summary of the change in post-burst potentials (t = 15 min minus t = 0 min response) in each condition. Each symbol represents the amplitude of individual experiments. One-way ANOVA, p < 0.0001; post hoc tests versus CCH, **p < 0.001. CCH, n = 13; Oxo, n = 8; McN-A, n = 10; 4-DAMP, n = 8; PZ, n = 8; MCT, n = 7; Trop, n = 7.