
Figure 3.
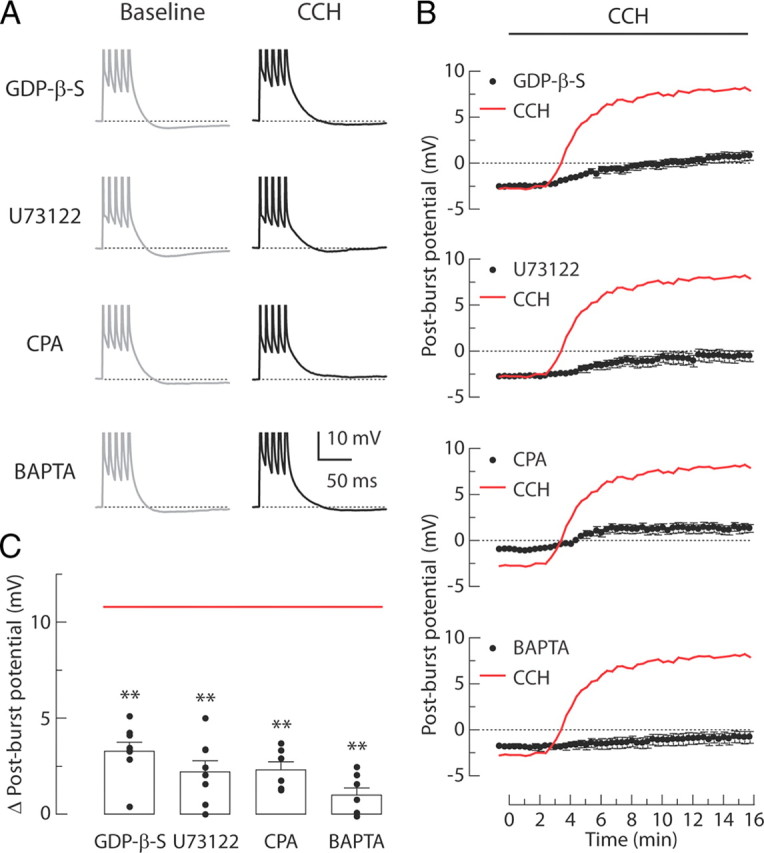
Signaling mechanisms involved in the CCH-induced post-burst ADPs. A, Individual responses to bursts of five APs in baseline condition (left, gray) or 15 min after CCH application (right, black). Experiments are performed in four different groups: 0.5 mm GDP-β-S, 20 μm U73122, 30 μm CPA, or 10 mm BAPTA. B, Time courses of the post-burst potential amplitudes after application of agonists beginning at t = 0 min. Red lines indicate the averaged response from the CCH-treated control group as in Figure 2B. C, Summary of the change in post-burst potentials (t = 15 min minus t = 0 min response) in each condition. Red line indicates the average of change in post-burst potentials from the CCH-treated control group in Figure 2C. Each symbol represents the amplitude of individual experiments. One-way ANOVA, p < 0.0001; post hoc tests versus CCH, **p < 0.001. GDP-β-S, n = 8; U73122, n = 8; CPA, n = 6; BAPTA, n = 7.