
Figure 8.
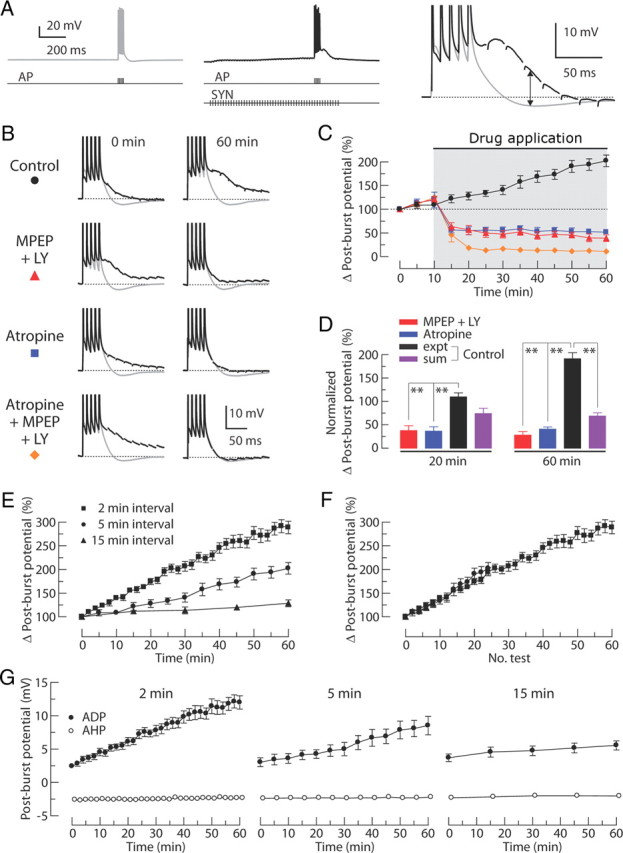
Effects of group I mGluR antagonists and mAChR antagonist on the post-burst ADP induced by synaptic stimulation (SYN) is paired with somatic AP to evoke the post-burst ADPs. Stimuli are five APs (100 Hz) alone or together with synaptic stimulation (50 Hz for 1 s). A, Typical responses from a single cell either without (left, gray) or with (middle, black) synaptic stimulation. Examples for each condition are expanded and overlaid on the right. Arrow indicates the difference between the AHP and the ADP (Δ post-burst potential). B, Alternating responses with and without synaptic stimulation (black and gray, respectively) are superimposed. Representative responses are obtained from the control group, 10 μm MPEP + 100 μm LY367385 (LY) group, 10 μm atropine group, or atropine + MPEP + LY367385 group at the beginning of the experiments (left, t = 0 min in C) and the end of the experiments (right, t = 60 min in C). C, Normalized change in post-burst potentials over time (control, n = 9; MPEP + LY367385, n = 7; atropine, n = 7; atropine + MPEP + LY367385, n = 7). Gray-shaded area indicates period of drug application. D, Summary of the change in post-burst potentials at t = 20 and t = 60 min in C. Responses from the control group, MPEP + LY367385 group, and atropine group are normalized to the magnitude of atropine + MPEP + LY367385 group. For the linear sum, nine randomly selected pairs were used from the independent measures in MPEP + LY367385 group and atropine group. One-way ANOVA, p < 0.0001; post hoc tests versus experiment (expt), **p < 0.001. E, Normalized change in post-burst potentials over time from experiments with different intervals between individual tests (2 min interval, n = 13; 5 min interval, n = 9; 15 min interval, n = 7). F, Data from E are replotted as a function of the number of tests. G, Absolute post-burst potential with or without synaptic stimulation (filled and open circles, respectively). Without synaptic stimulation, the post-burst AHP was stable in all groups.