
Figure 9.
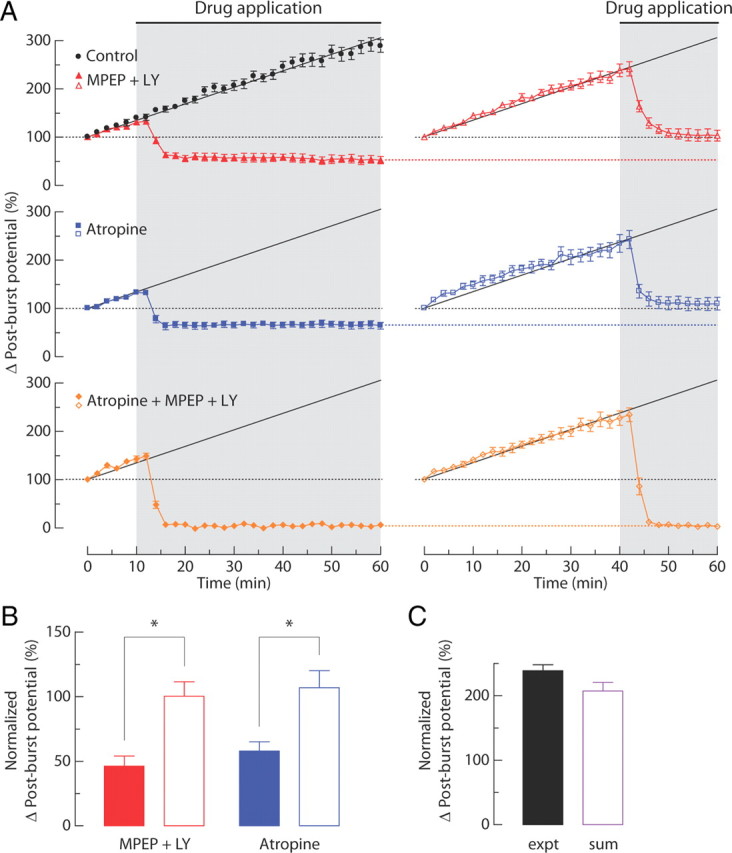
Effects of repeated synaptic stimulation on the post-burst potential induced in the presence of group I mGluR antagonists and mAChR antagonist. A, Normalized changes in post-burst potentials over time. Gray-shaded area indicates period of drug application (filled symbol, from t = 10 min; open symbol, from t = 40 min). A linear regression line to the control group is shown by a black line. B, Summary of the change in post-burst potentials at the end of experiments in MPEP + LY367385 (LY) and atropine group (filled bars, t = 60 min after drug application at t = 10 min; open bars, t = 60 min after drug application at t = 40 min). C, Change in post-burst potentials in the control at t = 42 min and the sum of MPEP + LY367385 and atropine group (open symbol in A) at t = 60 min. For the linear sum, 13 randomly selected pairs were used from the independent measures in MPEP + LY367385 group and atropine group. Unpaired t test, *p < 0.01. Control, n = 13; MPEP + LY367385, n = 7 each; atropine, n = 8 each; atropine + MPEP + LY367385, n = 7 each. expt, Experiment.