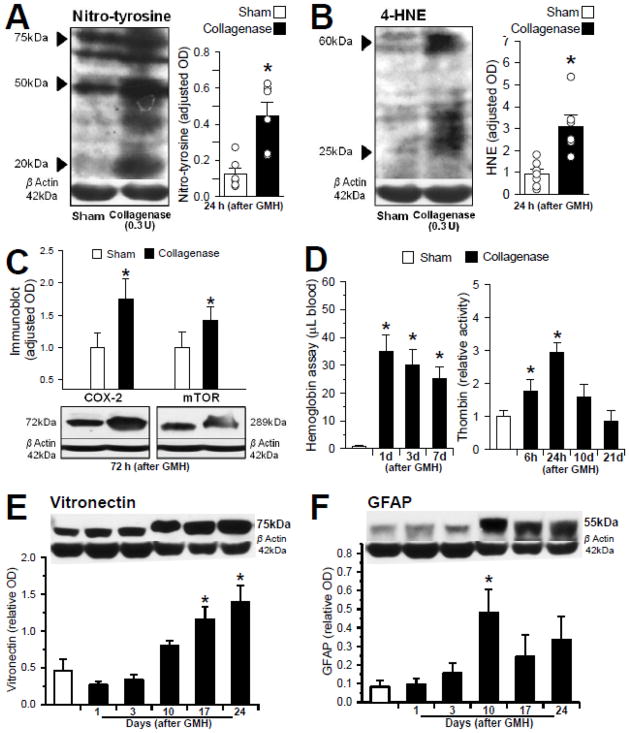
Fig. 2. Mechanisms of Brain Injury following GMH.
Representative Western blot analyses at 24 hours (A,B) and 72 hours (C) post-GMH: (A) nitrotyrosine [range MW= 20–75 kDa; n=6/group], (B) 4-HNE [range MW= 25–60 kDa; n=6/group], (C) COX-2 [left, MW= 72 kDa; n=4/group] and the phosphorylated product of mTOR [right, MW= 289 kDa; n=4/group]. (D) Blood component quantification: Hemoglobin at 1, 3 and 7 days (left; n=3/group) and Thrombin at 6 and 24 hours, 10 and 21 days (right; n=4/group). Representative Western blot analysis of samples from 1 to 24 days (E) vitronectin [MW= 75 kDa; n=6/group] and (F) GFAP [MW= 55 kDa; n=6/group]. Values are expressed as mean ±SEM. *P<0.05 compared with controls (sham and needle trauma)

