
Figure 2. P-gp and BCRP protein expression increases are specific to the spinal cord and cerebral cortex of the CNS.
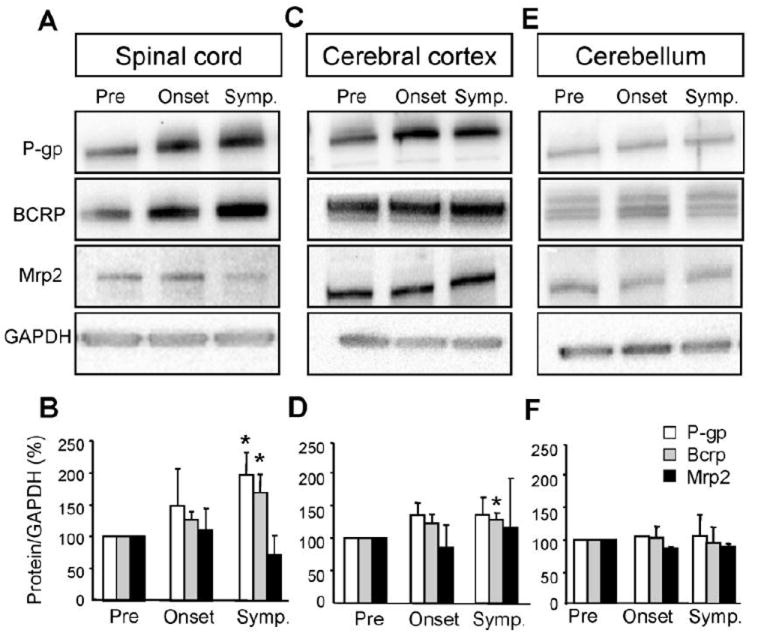
Disease-driven increases of P-gp and Bcrp protein expression in SOD1-G93A mice are specific to the spinal cord (A,B) and cerebral cortex (C,D) compared to the cerebellum (E,F). The band intensity of transporter expression levels were normalized to loading controls (GAPDH) and quantifications include a minimum of three independent experiments (n = 3). Data analysis was performed using two-tailed Student’s T-tests. *P < 0.05, data are shown as mean ± SEM. Abbreviations: Pre = Presymptomatic mice at 50 days; Onset = Mice at onset of symptoms at 90 – 100 days; Symp = Symptomatic mice at 130 days.