
Figure 5. P-gp and BCRP expression levels increase at the blood-spinal cord barrier.
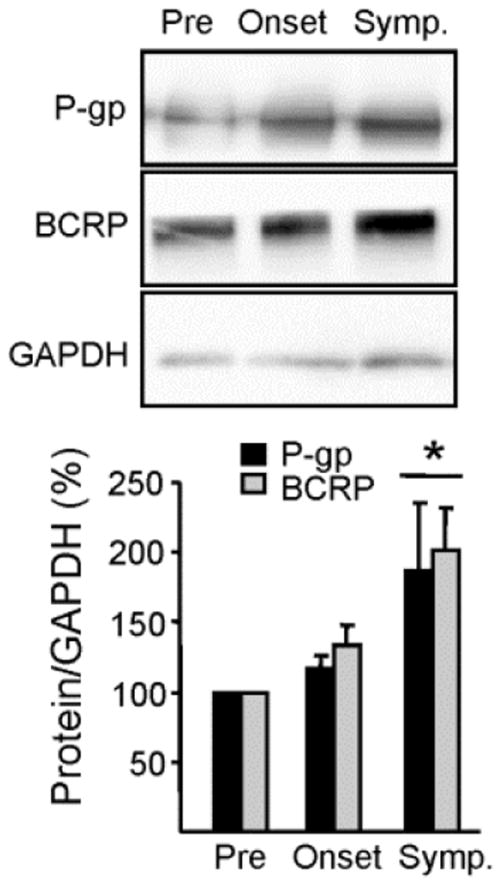
Isolated spinal cord microvessels show a protein expression increase in the drug transporters, P-gp and Bcrp, throughout disease progression in SOD1-G93A mice (*p < 0.05). Transporter expression levels were normalized to loading controls (GAPDH) and quantifications include a minimum of three separate experiments. Data analysis was performed using two-tailed Student’s T-tests. Data are shown as mean ± SEM. Abbreviations: Pre = Presymptomatic mice at 50 days; Onset = Mice at onset of symptoms at 90 – 100 days; Symp = Symptomatic mice at 130 days.