
Figure 6. P-gp and BCRP activity is increased in symptomatic SOD1-G93A mice.
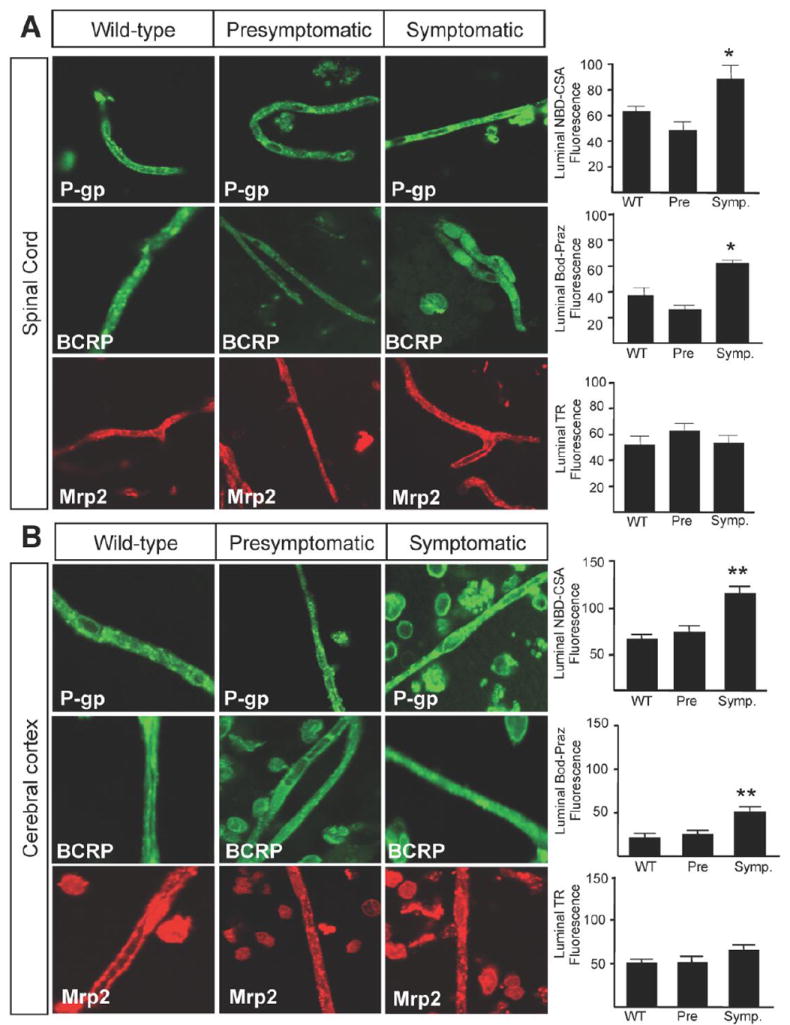
The functional transport increases in the drug transporters, P-gp and Bcrp, in isolated spinal cord (A) and cerebral cortex (B) capillaries throughout disease progression in SOD1-G93A mice (*p < 0.01; **p < 0.001). There was no change in the transport activity of Mrp2 in spinal cord (A) or cerebral cortex (B) capillaries. Specific transport activity was determined by quantification of luminal fluorescence in presence of inhibitor subtracted from the luminal fluorescence in the absence of inhibitor for each transporter. Data analysis was performed using one-way analysis of variance (ANOVA). Data are shown as mean ± SEM. Data are shown as mean ± SEM. Abbreviations: Pre = Presymptomatic mice at 50 days; Onset = Mice at onset of symptoms at 90 – 100 days; Symp = Symptomatic mice at 130 days; NBD-CSA = [N-(4-nitrobenzofurazan-7-yl)-D-Lys8]-cyclosporin A; Bod-Praz = BODIPY FL Prazosin; TR = Texas Red.