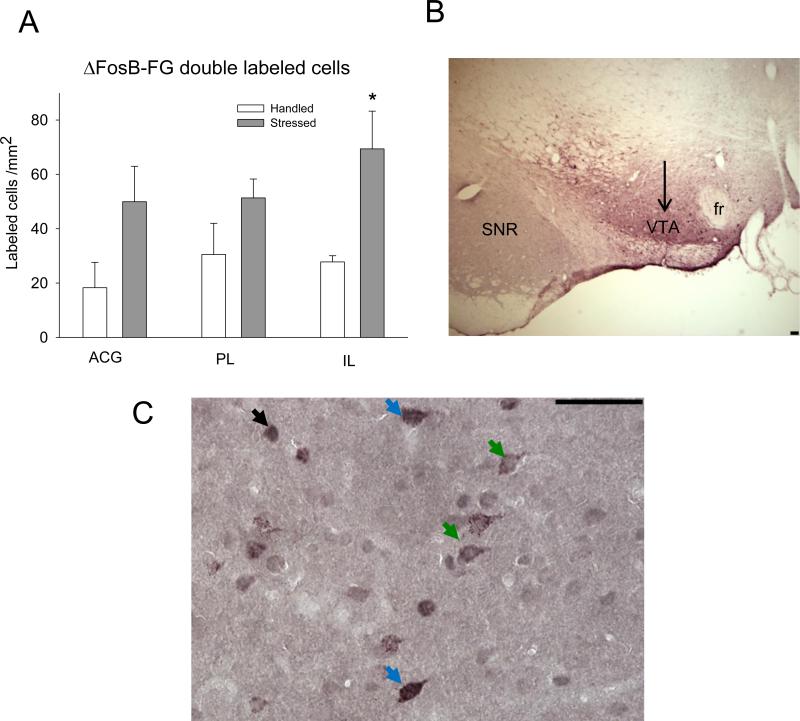
Figure 4. Effect of intermittent social defeat stress on ΔFosB/FG labeling in PFC regions.
ΔFosB/FG immunolabeling expressed as labeled profiles/mm2 (n = 5-6). *P ≤ 0.05 vs. handled group. B. – Representative low magnification microphotograph of FG immunolabeling in the VTA. The arrow is directed at the purple FG labeling in the VTA region. SNR –substania nigra reticulata; fr –fasciculus retroflexus. C – Representative photomicrograph of ΔFosB and FG immunolabeling in IL region of the PFC. ΔFosB profiles are represented by a dark grey nuclear label, and FG cells are labeled with a granular purple cytoplasmic stain with an empty nucleus. ΔFosB/FG cells contain contain a dark nuclear ΔFosB label surrounded by diffusely labeled purple cytoplasm. Black arrow: ΔFosB; green arrow: FG; blue arrow: ΔFosB/FG double-labeling. Scale bar 100 μm.

