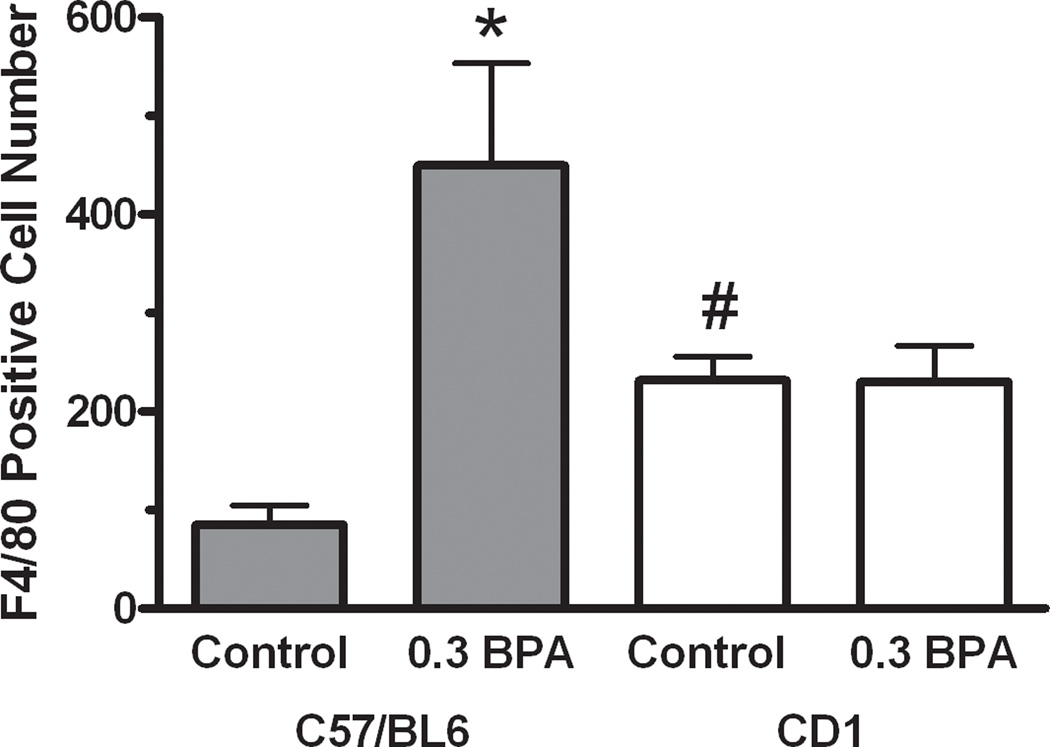
Figure 4.
Quantitative comparison of F4/80 immunoreactive cell numbers in the uterus of control and BPA treated C57BL/6 and CD1 mice. Immunopositive macrophage cell numbers present in the myometrium and endometrium were counted by an observer blinded to treatment and strain. Values indicated are mean cell numbers present in one 40x field of the myometrium and one field of the endometrium of a single section per animal. Error bars represent the SEM. For C57BL/6, n=4 animals, and for CD1, n=5 animals. The level of significance between values was assessed using a one-way ANOVA. * indicates the level of differences between values of same strain control group and BPA treated group are significant (P< 0.01); # indicates that the level of difference between values for each control group is significant (P< 0.01). No difference was observed between C57BL/6 and CD1 mice treated with 0.3 ppm BPA.

