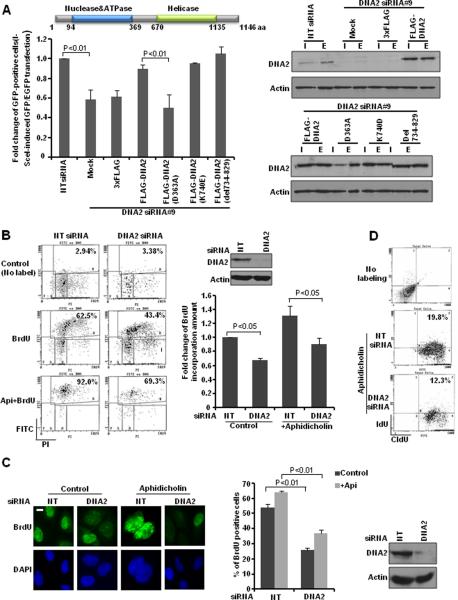
Figure 4. DNA2 facilitates HR repair and replication fork restart.
A, DRGFP cells were transfected with the indicated constructs. (Left) Quantitative summary of at least three independent experiments. Each value is relative to the percentage of GFP-positive cells in I-SceI-transfected control cells, which was set to 1 and represents the mean ± SD. A schematic diagram of DNA2 structure is shown at the top. (Right) Western blot analyses demonstrating effective transfection (I: I-SceI-transfected samples; E: EGFP-transfected samples as controls to normalize transfection efficiency). B, Forty-eight hours after transfection with control or DNA2 siRNA, U2OS cells were untreated or treated with aphidicolin (Api) (5 μM) for 17 hr. Then cells were released and labeled with BrdU (10 μM) for 30 min. (Left) Representative flow cytometry profile. (Right) Quantitative summary. Each value is relative to the percentage of BrdU-positive cells in cells with control siRNA transfection, which was set to 1 and represents the mean ± SD. C, U2OS cells were transfected with control siRNA or DNA2 siRNA. Forty-eight hours later, cells were treated or untreated with aphidicholin (5 μM) overnight. (Left) Representative images of BrdU incorporation detected in denatured conditions 30 min after BrdU (10 μM) labeling (scale bar: 5 μm). (Right) At least 50 cells were scored in each sample. Each value represents the mean ± SEM from two independent experiments. D, U2OS cells were transfected with control or DNA2 siRNA. Forty-eight hours later, cells were labeled with CIdU (25 μM) for 30 min and then were treated with camptothecin (1 μM) for 1 hr and released in culture medium containing IdU (250 μM) for 1 hr. Cells were stained with antibodies recognizing IdU (red) and CIdU (green). The percentage of double-positive cells is indicated. Quantitative summary is shown in Supplementary Fig. S4A. Western blot analyses demonstrating effective DNA2 knockdown are shown next to the graphs.

