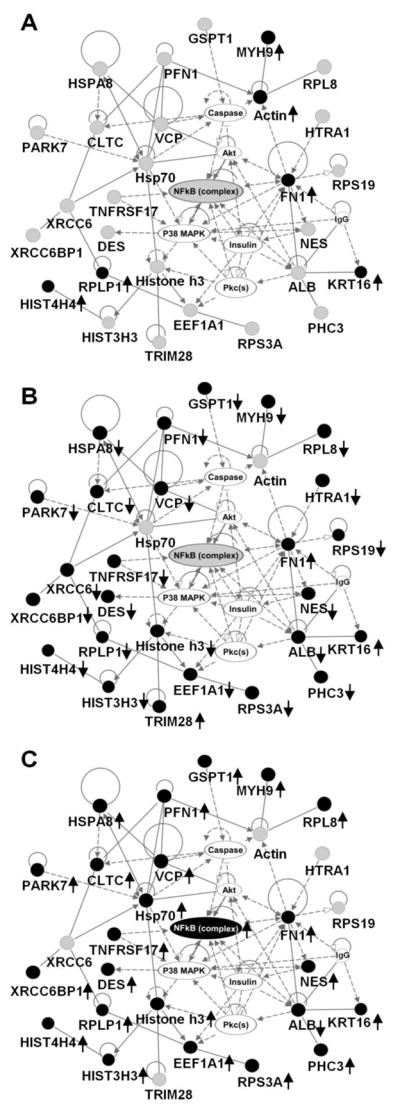
Figure 1.

Top connectivity network with p-value 10-65 showing changes in expression of proteins involved in NFκB network in basal and insulin stimulated states with and without PMI 5011 treatment. (A) baseline control vs. insulin stimulated control, (B) baseline control vs. PMI 5011 treated, (C) PMI 5011 treated vs. PMI 5011 treated and insulin stimulated. Proteins labeled with filled circles were identified to be differentially regulated in each comparison. Proteins labeled with gray circles were identified but are not differentially regulated. Proteins labeled with plain circles are imported from the IPA knowledge base. A line indicates interactions, and the dotted lines indicate an inferred or indirect interaction. The abbreviations are: CLTC: clathrin heavy chain, DES: desmin, EEF1A1: eukaryotic translation elongation factor 1 alpha 1, FN1: fibronectin 1, GSPT1: G1 to S phase transition 1, HIST3H3: histone cluster 3 H3, HIST4H4: histone cluster 4 H4, HSPA8: heat shock 70kDa protein 8, HTRA1: HtrA serine peptidase 1, KRT16: keratin, MYH9: myosin heavy chain 9, NES: nestin, PARK7: Protein DJ-1, PFN1: profilin 1, RPL8: ribosomal protein L8, RPLP1: ribosomal protein (large, P1), RPS19: ribosomal protein S19, RPS3A: ribosomal protein S3A, TNFRSF17: tumor necrosis factor receptor 17, TRIM28: cDNA FLJ94025 highly similar to Homo sapiens tripartite motif containing 28, VCP: valosin-containing protein, XRCC6BP1: Mitochondrial inner membrane protease ATP23 homolog.
