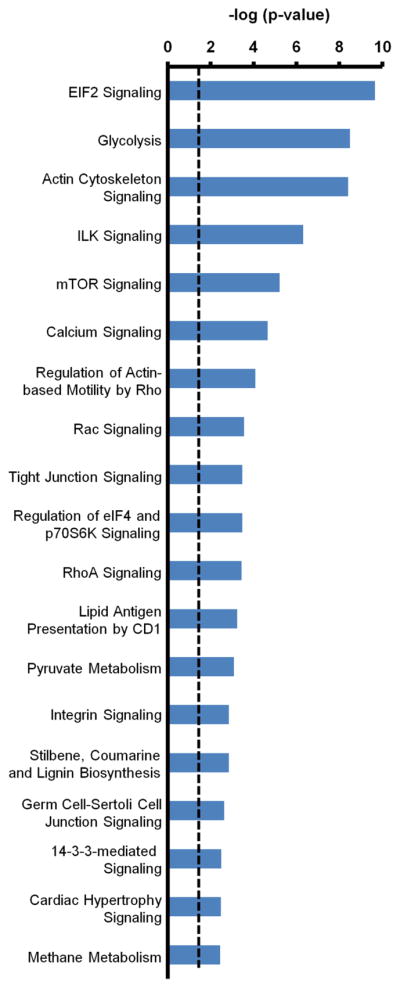
Figure 2.

Canonical pathways identified using IPA for proteins differentially regulated due to insulin stimulation after PMI 5011 treatment. The levels of these proteins were unchanged due to PMI 5011 treatment alone. The dotted line represents the threshold of significance (p = 0.05). The length of the bars is a measure of significance (-log of p-value) that identified proteins are part of the specified canonical pathway.
