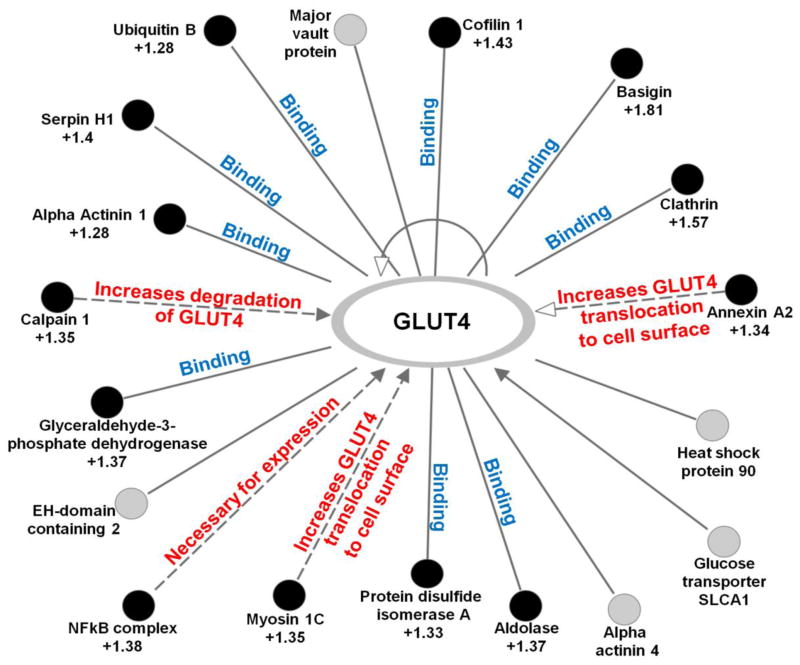
Figure 4.
Interaction network of proteins for SLC2A4 (GLUT4) generated using IPA. Proteins identified as significantly differentially regulated (p < 0.05) due to insulin stimulation in the presence of PMI 5011 compared to PMI 5011 alone are shown as filled circles. The fold change for each of these proteins is indicated in the Figure. Proteins labeled with gray circles were identified but are not differentially regulated.

