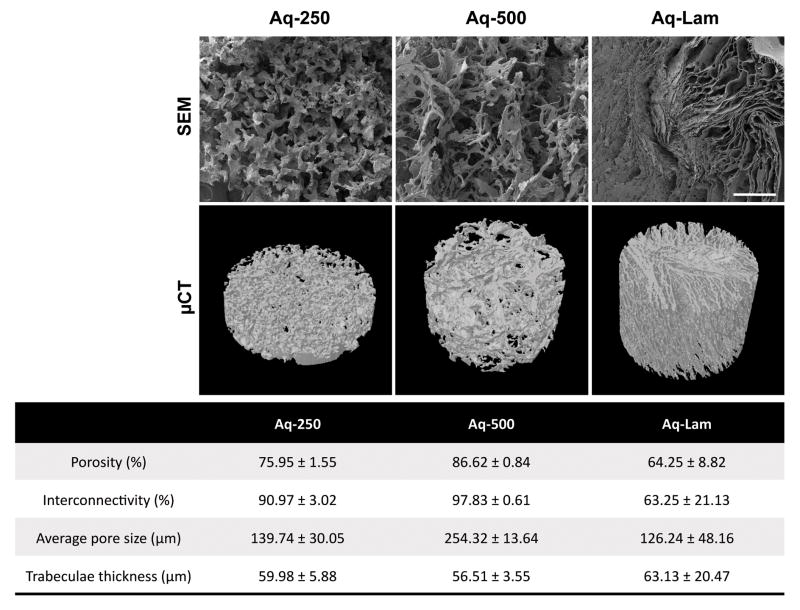
Figure 3. Aqueous-based silk fibroin scaffolds characterization.
Top row) Scanning electron microscopy (SEM) images of Aq-250, Aq-500 and Aq-Lam scaffolds demonstrating pore morphology and wall surface. Scale bar = 500 μm. Middle row) Micro-computed tomography (μCT) 3D reconstruction of silk fibroin scaffolds. Bottom) Morphometric parameters obtained by μCT analysis.

