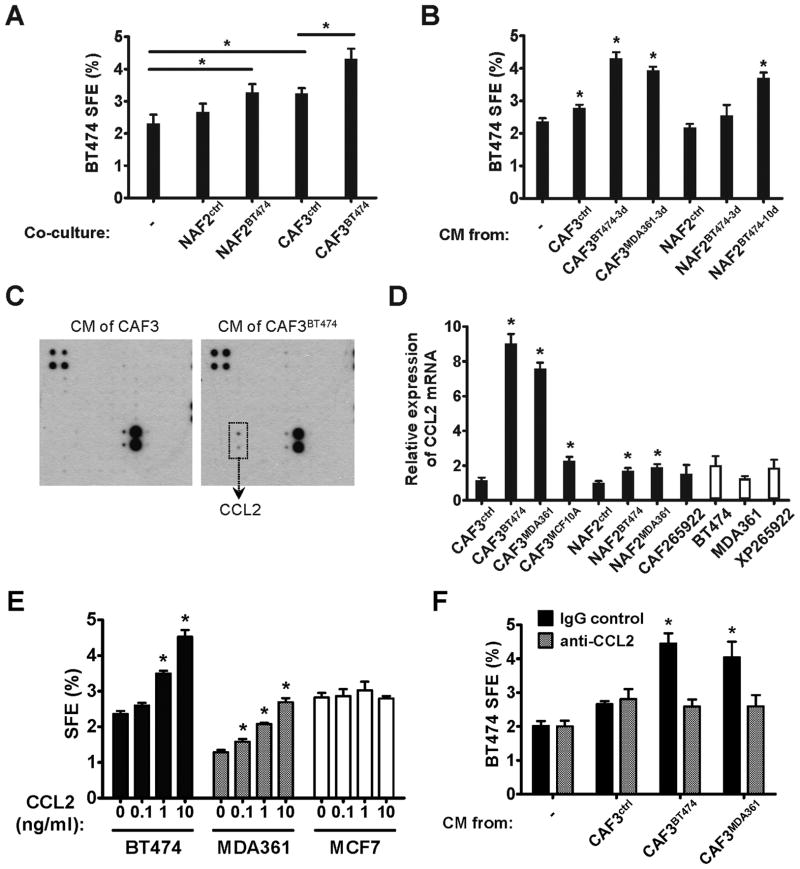
Fig. 1. CCL2 secreted by cancer-activated fibroblasts induces mammosphere formation in BC cells.
(A) Mammosphere formation assay of BT474 cells co-cultured with various fibroblasts. NAFs and CAFs were first co-cultured with BT474 cells growing in transwell inserts for 3 days (NAF2BT474 and CAF3BT474), or cultured alone (NAF2ctrl and CAF3ctrl), before being transferred to transwell inserts and co-cultured with freshly plated BT474 cells for mammosphere assays. Spheres were counted on day 10, and sphere forming efficiency (SFE) was calculated. * p<0.01. (B) Mammosphere formation assay of BT474 cells exposed to the conditioned media (CM) of differentially treated fibroblasts. Fibroblasts were first treated with BT474- or MDA361-derived CM for 3 or 10 days as indicated by “3d” or “10d” in the superscript, or with regular medium (NAF2ctrl and CAF3ctrl). Treated fibroblasts were then cultured in sphere-forming media for 24 h to prepare CM subsequently used in BT474 sphere formation assays. * p<0.01 compared to the control (the first column). (C) CM was collected from CAF3 that had been previously treated for 3 days with BT474 CM (CAF3BT474), and from untreated CAF3 as a control. Concentrated CM was subjected to a cytokine antibody array. Induction of CCL2 protein was observed in the CM of CAF3BT474. (D) Relative expression of CCL2 mRNA in various cell types was determined by RT-qPCR. CAF265922 (primary CAFs) and XP265922 (primary tumor cells) were isolated from the same BC specimen. The superscripts denote CM treatments as in (B). The time length of CM treatment was 3 days in CAF3 and 10 days in NAF2. * p<0.01 compared to the untreated control CAF3 or NAF2. (E) BT474, MDA361, and MCF7 BC cells were assayed for sphere formation in the presence of CCL2 at the indicated concentrations. * p<0.01 compared to the control (no CCL2 treatment) in each cell line. (F) Effect of CAF CM (as indicated in B) on BT474 sphere formation in the presence or absence of a CCL2 neutralizing antibody. * p<0.01 compared to the control (the first column). Each bar represents the mean ± S.D. of 3 wells.

