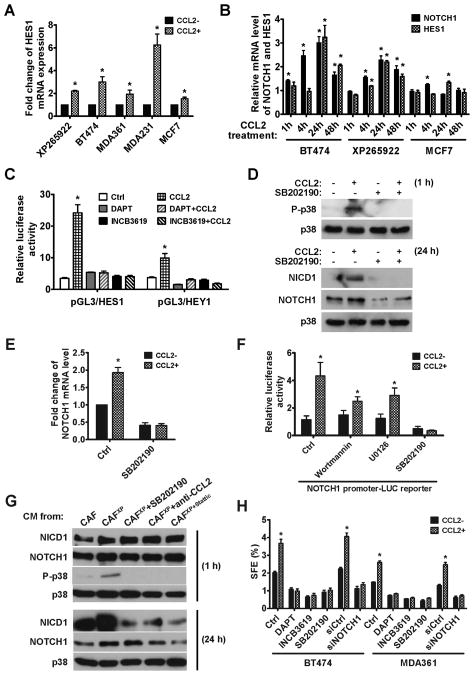
Fig. 4. CCL2 regulates CSC phenotype in BC cells by activating NOTCH signaling.
(A) Total RNA isolated from various BC cell lines treated with CCL2 or vehicle for 24 h were analyzed for the expression of HES1, a target gene activated by NOTCH signaling. Data of RT-qPCR were normalized to 18S in each sample. Each bar represents the mean ± S.D. of 3 wells. * p<0.001 compared to the control (the first column). (B) Expression of NOTCH1 and HES1 mRNAs upon CCL2 treatment in the indicated time course. The mRNA level at each time point was compared to that in untreated cells, which was set as 1. Each bar represents the mean ± S.D. of 3 wells. * p<0.01 compared to untreated cells. (C) Luciferase reporters of HES1 and HEY1 were transfected into XP265922 primary BC cells. Luciferase activity was analyzed at 24 h post CCL2 treatment +/− inhibitors of γ-secretase (DAPT; 10 μM) or α-secretase (INCB3619; 5 μM). Each bar represents the mean ± S.D. of 3 independently transfected wells. * p<0.001 compared to the control (the first column). (D) Western blot analysis of p38 and NOTCH1 at indicated time points following treatment conditions in XP265922 cells. (E) Expression of NOTCH1 mRNA in XP265922 cells treated with CCL2 +/− SB202190 (5 μM) for 24 h. * p<0.001 compared to the control (the first column). (F) A luciferase reporter containing a 6-kb NOTCH1 promoter was transfected into XP265922 cells to analyze NOTCH1 promoter regulation by CCL2 and various inhibitors (Wortmannin: 1 μM; U0126: 10 μM; SB202190: 5 μM). Each bar represents the mean ± S.D. of 3 independently transfected wells. * p<0.001 compared to the control (the first column). (G) XP265922 cells were treated with CM from indicated sources and analyzed for NOTCH1 and p38 expression by Western blot. (H) Mammosphere formation assay of BC cells treated with various inhibitors in the presence or absence of CCL2. Each bar represents the mean ± S.D. of 3 wells. * p<0.01 compared to the control (the first column in each cell line).

