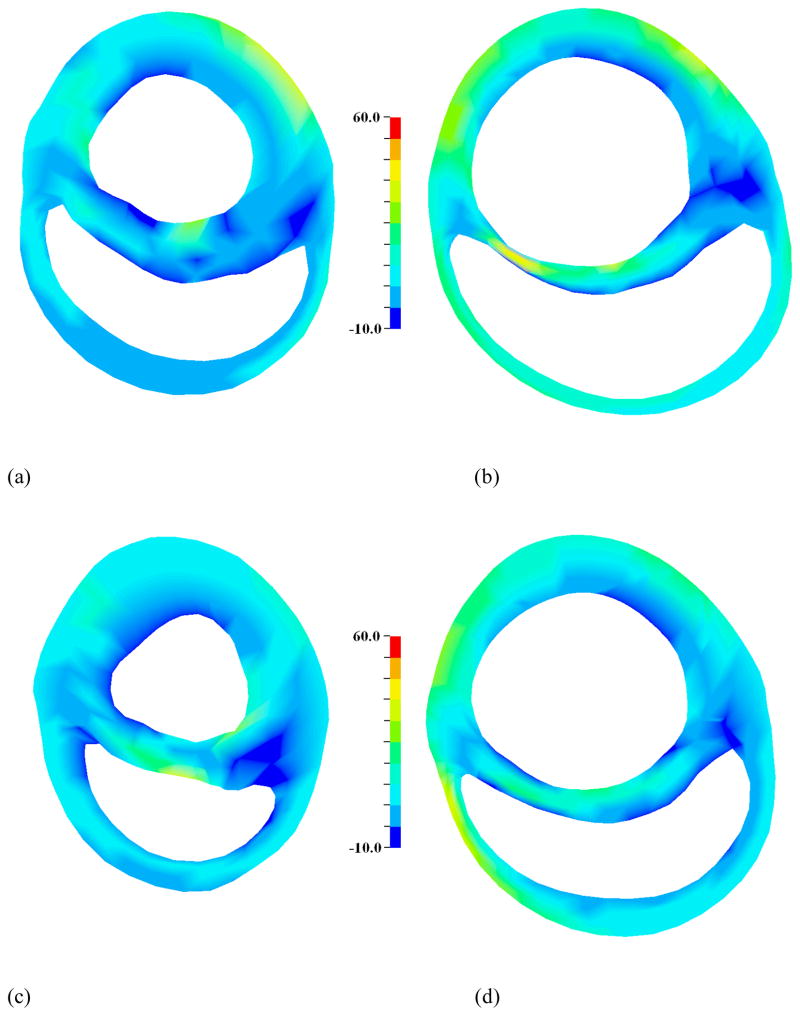
Figure 9.
Stress in the myofiber direction at end-systole for slices taken 10 mm below the base for (a) normal and (b) CHF, and 25 mm below the base for (c) normal and (d) CHF. Stress is elevated in the CHF case, relative to normal. Scale bar is in kPa. It should be noted that stress is calculated as constant within each element and then smoothed for the graphical presentation.

